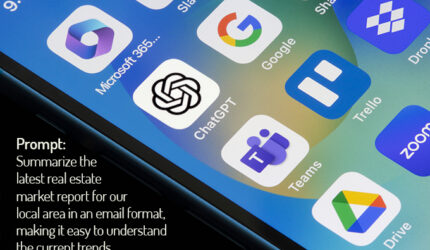
Writing a Neighborhood Profile
July 27, 2008 by Esther
Imagine if you were a future homebuyer purchasing in an area you were not familiar with. Being able to read different neighborhood profiles would give you a better understanding of the area and help you choose the location that meets your needs. Writing neighborhood profiles is an excellent way to give your audience an abundance of information they will want. From a search engine standpoint, it’s also an excellent way to incorporate keyword rich search term’s into your site to help in getting better rankings.
Looking for suggestions on what to write about? Take these items into consideration, but don’t feel like you have to do them all. Start with the basics and follow up with additional posts to give more information and fresh content.
Demographics:
Extremely helpful neighorhood information would be the local demographics i.e. unemployment figures, population, seasonal climate, and so on. Look to your local government office for this type of information or better yet, look for websites online that offer demographic information.
Market Data:
Include some basic information about the average cost of homes in a neighborhood. This will give visitors an idea of what homes typically sell for and helps give them a better idea of what to expect. For example: Homes in this neighborhood typically range from $250,000 to $500,000. Instantly a potential buyer would know if they see a home for sale at $800,000 - they may want to research it further as it appears that home is at the top of the market. For more information on the benefits of adding more complete market reports, visit our article on The Value of Writing Market Reports.
Informative Maps:
Adding graphical maps is also a great way of offering more information. If you can, include a small map showing the neighborhood in relationship to other places that your audience may or may not know about i.e. the beach, ski resorts, downtown, shopping etc. It is another great way of giving your audience perspective. Google Maps is a good source for mapping. Take a screenshot of the map once you are zoomed into your desired location. Save it to your desktop (using Print Screen). You can then resize, crop and dress up the image using Picnik, a great online photo editing web site. Another idea is to use Google or UMapper to create an interactive map that can be added to your page.
Include Photos:
Photos of homes, hot spots and landmarks will give your audience an even better idea of the neighborhood. Consider not just images of local homes, but also hot spots i.e. beaches, ski resorts, shopping centers etc. I recommend using The NextGen Gallery plugin that helps create a stylish photo gallery of images as demonstrated on our demo site: Heavenly Valley Neighborhood profile.
Don’t under estimate the value of neighborhood profiles. They are one of the best subjects you can write about. It is a great way to demonstrate your knowledge of the area, increase your visibility in the search engines and keep people coming back, as you continually provide fresh content that relates to the area.

If you enjoyed this post, make sure you subscribe to our RSS feed!
The Value of Writing Market Reports
July 11, 2008 by Esther

Offering real estate market updates is one of the best ways to communicate to your audience that your are an “expert in your region” and know the market. It might be boring to you, but it could be valuable information to your buyers and sellers who “want / need” this type of information to make and informed decision. Your ability to serve up this important information could get you new buyers and sellers who are looking for a agent who demonstrates their knowledge online.
Where to Find the Data:
Your multiple listing service is the best place to start. Typically you can run reports from you MLS software and get exactly what you need. If you can’t find what you are looking for, contact your local Association or MLS tech support.
Setting Up the Data:
Start with developing an Excel spread sheet that can be easily updated each month. To really define each area, set up a seperate spreadsheet for every zip code or neighborhood that you work. Think about the different catagories you will want to set up that and are going to be of most interest to your audience i.e number of “Units Sold,” “Days on Market,” average “Sold Price,” median “Sold Price,” and finally the Sold Price vs. List Price.
Communicating the Data:
If your not savvy with creating graphs and charts then convey the information in simple narrative copy. Take the time to interject your thoughts giving your knowledge and opinions. Again, engaging the visitor and demonstrating your professional expertise on the matter.
If you are looking for graph formats then check out MS Excel’s “the graph wizard.” Other resources for creating graphs is using Microsoft Word or Microsoft Publisher. There will be a learning curve, but the visual rewards could be worth it. I will say it again, offering real estate market updates is one of the best ways to communicate to your audience that your are an “expert in your region.”
To further your knowledge on creating Blog market reports we suggest you read “Why Bore Blog Readers With Statistics?” By Margaret Woda. Be sure to read the comments from other agents and their experiences.
If you enjoyed this post, make sure you subscribe to our RSS feed!