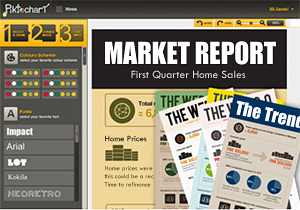
 Online visuals are fast becoming the most popular way to tell a story or converge data. Just look at the popularity of Pinterest. Piktochart brings visual story telling to a whole new level with a tool that allows anyone to create a professional quality infographic using his or her own data.
This amazing service allows users to create engaging infographics using pre-designed templates. There is a selection of free templates that can be customized for your needs. There is also an option to upgrade to Piktochart Pro which costs a fee but comes with over 40 template options. You can create an infographic in as little as 30 minutes using the Piktochart design tool, which is easy to use and allows users to customized template fonts, colors, and graphics. View their video demo.
What does this mean for real estate agents?
You can take any interesting real estate related data and use Piktochart to create an infographic that will engage your audience as well as educate them.
Piktochart could be used to:
- Create compelling market reports
- Compare your office performance with other offices
- Show how your office sells more of a specific kind of home (i.e., luxury homes)
- Demonstrate how you sell more homes in a specific community
- Show secondary home ownership in a resort-type area (i.e., Lake Tahoe)
- Make a demographics chart of an area you serve the most
Visually pleasing as well as informative, a vibrant infographic or chart is sure to engage your audience, draw them back, and get them to share with friends through social media. It is the perfect way to simplify complex information and present it in a professional format. We encourage you to check out this new tool and consider it as a way to modernize your site with fresh content and appealing information.
Please leave a comment and let us know your ideas!

